Use one of the two SSH commands below (run as root) to capture network and hardware telemetry from your ESX host. For standalone ESXi environments without NSX, use the Net-stats script instead.
Automated Diagnostic Framework on system with NSX
Use the ADF collector if your host is prepared for VMware NSX—it gathers the most complete set of diagnostic telemetry.
[root@esx-0-00-25-0-0-0:~] python /opt/vmware/nsx-common/python/adf/nsx_adf_collect.py -o /tmp/ -z "ADF_$HOSTNAME.tgz" -a -x 5
Example adf dump files:
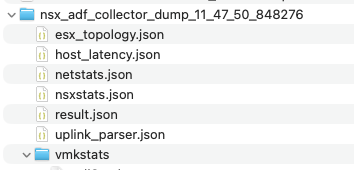
Understanding the ADF Collector Options
The Automated Diagnostic Framework (ADF) supports several collection modes and options. The example above captures multiple samples of host networking activity, but the collection can be customized depending on the troubleshooting scenario.
The flags used in the example are:
Flag
Description
-o /tmp/
Specifies the output directory for collected diagnostic data.
-z "ADF_$HOSTNAME.tgz"
Packages the collected data into a compressed archive. Using $HOSTNAME helps distinguish captures from different ESXi hosts.
-a
Enables advanced collection, gathering additional diagnostic information.
-x 5
Collects five samples rather than a single snapshot, allowing changes in network counters to be observed over time.
Additional ADF Options
The collector provides several additional options for controlling sampling behavior and managing longer-running captures.
Flag
Description
-i <seconds>
Specifies the interval between samples.
-d
Enables daemon mode, allowing collection to continue without occupying the interactive shell.
-t <seconds>
Specifies the collection duration in daemon mode. The documented default is 300 seconds.
-n
Checks the status of an active daemon-mode collection.
-k
Stops an active daemon-mode collection.
Example: Collecting Over a Defined Period
For intermittent network performance issues, collecting over a fixed duration can be more useful than capturing a predetermined number of samples.
The following example runs ADF in daemon mode for five minutes, with a 10-second sampling interval:python /opt/vmware/nsx-common/python/adf/nsx_adf_collect.py \ -o /tmp/ \ -z "ADF_$HOSTNAME.tgz" \ -a -d -i 10 -t 300
To check whether a daemon-mode collection is running:python /opt/vmware/nsx-common/python/adf/nsx_adf_collect.py -n
To stop an active daemon-mode collection:python /opt/vmware/nsx-common/python/adf/nsx_adf_collect.py -k
Practical considerations: Use interactive mode (-x) when a specific number of samples is sufficient, and daemon mode (-d) when troubleshooting a problem that requires an extended observation window. Longer collections may generate substantial diagnostic data, so ensure sufficient storage is available. Whenever possible, run the collection while the performance issue is occurring.
For the complete set of supported options, consult the collector’s built-in help on the target ESXi host, as behavior may vary by version.
Reference: Broadcom KB 380660 – Troubleshooting NSX Edge and Virtual Machine Network Performance
Net-stats on an ESXi system without NSX
This script runs a lightweight, 10-second network performance capture on standard ESXi hosts where NSX diagnostic tools aren’t available. It snapshots physical NIC hardware counters (vsish) immediately before and after running net-stats (-tqQWSh) to record queue metrics, world/system CPU time, and packet size histograms, then bundles all outputs into a single .tar.gz archive in /tmp for easy download.
[root@esx-0-00-25-0-0-0:~] cat << 'EOF' > /tmp/capture-net-stats.sh && chmod +x /tmp/capture-net-stats.sh && /tmp/capture-net-stats.sh#!/bin/sh# VMware ESX Streamlined Network Profiling CapturecurrDate=$(date +%Y-%m-%d_%H-%M-%S)outDir="/tmp/NetStats-$currDate"mkdir -p "$outDir" && cd "$outDir"echo "[1/3] Capturing BEFORE physical NIC hardware counters..."for nic in $(esxcfg-nics -l | awk 'NR>1 {print $1}'); do vsish -e get /net/pNics/$nic/stats > $nic-stats-before.txt 2>/dev/nulldoneecho "[2/3] Running 10-second net-stats profiling..."net-stats -i 10 -tqQWSh -A > netstats-$currDate.jsonecho "[3/3] Capturing AFTER physical NIC hardware counters..."for nic in $(esxcfg-nics -l | awk 'NR>1 {print $1}'); do vsish -e get /net/pNics/$nic/stats > $nic-stats-after.txt 2>/dev/nulldoneecho "Packaging results..."cd /tmptar -czf "NetStats-$currDate.tar.gz" "NetStats-$currDate"echo "10-second profiling complete! Archive saved to: /tmp/NetStats-$currDate.tar.gz"EOF
Example net-stat files:
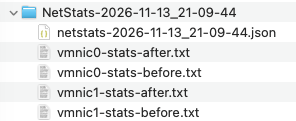
Unlike running net-stats alone, this script also captures before-and-after snapshots of physical NIC counters using vsish. Comparing these snapshots allows diagnostic tools to calculate changes in hardware-level statistics, including packet drops, errors, and potentially ring buffer overflows or per-queue counters, depending on the NIC hardware and driver. This provides complementary visibility into physical NIC behavior that may not be exposed by the selected net-stats categories. All collected data is packaged into a single .tar.gz archive in /tmp for easy download and offline analysis.
Understanding the Net-Stats Collection Options
net-stats is a native ESXi utility that provides detailed visibility into network port activity, packet processing, CPU utilization, and other networking statistics. Unlike ADF, it does not require NSX components to be installed.
The script above uses:net-stats -i 10 -tqQWSh -A
The flags control the sampling interval, the statistics collected, and the scope of the collection.
Flag
Description
-i 10
Uses a 10-second sampling interval.
-t
Specifies the categories of statistics to collect. The characters following it (qQWSh) are individual statistics selectors.
-A
Collects statistics for all host network ports.
Statistics Collected in This Example
The -tqQWSh argument combines five statistics categories:
Selector
Description
q
Network queue statistics for ports and NICs.
Q
Detailed queue statistics, providing deeper visibility into queue activity.
W
Network world statistics, including transmit and physical/VMkernel NIC processing worlds.
S
System CPU time breakdown by physical CPU.
h
Cluster and packet-size histograms, useful for understanding packet distribution and traffic characteristics.
These statistics provide a useful starting point for investigating network throughput, queue behavior, packet processing overhead, and CPU utilization.
Additional Statistics Selectors
Depending on the problem being investigated, other statistics can be included by adding their corresponding characters to the -t argument.
Selector
Description
v
Virtual NIC statistics.
e
Detailed error statistics.
i
Physical NIC interrupt statistics.
c
Virtual NIC interrupt coalescing statistics.
V
vCPU histograms.
n
Network I/O Control (NIOC) statistics.
f
Detailed queue-filter information.
p
Passthrough and SR-IOV statistics.
P
Detailed passthrough and SR-IOV statistics.
E
Enhanced Network Stack (ENS) statistics, where supported.
I
IOChain input-filter statistics.
O
IOChain output-filter statistics.
For example, to extend the original capture with virtual NIC statistics, detailed errors, and interrupt statistics:net-stats -i 10 -tqQWShvei -A
Additional Collection Options
The utility also supports options for controlling the collection scope, duration, and output.
Flag
Description
-n <count>
Specifies the number of sampling iterations. Defaults to one.
-o <file>
Writes statistics to a specified output file.
-l
Lists network ports and their identifiers.
-p <portid>
Collects statistics for a specific network port.
-N <vmnic>
Collects statistics for ports on the switch associated with the specified physical NIC.
-V <vmname>
Collects statistics associated with a particular VM’s network ports and uplinks.
-S <switch>
Collects statistics associated with a specific virtual switch.
-a
Reports absolute counter values instead of per-second rates.
Note: Flags and statistics selectors are case-sensitive. For example, -S identifies a virtual switch, while S within the -t argument requests per-CPU system time statistics.
Example: Extended Collection
For intermittent network issues, the number of sampling iterations can be increased:net-stats -i 10 -n 6 -tqQWSh -A > /tmp/netstats.json
This requests six sampling iterations at 10-second intervals, providing a longer observation period for detecting performance changes.
The available statistics may vary depending on ESXi version, NIC driver, and enabled networking features. Use net-stats -h on the target host to confirm the supported options.
References:
- Broadcom KB 380660 – Troubleshooting NSX Edge and Virtual Machine Network Performance
- Broadcom KB 461974 – Datapath Performance Analysis Using perf_analyzer.py
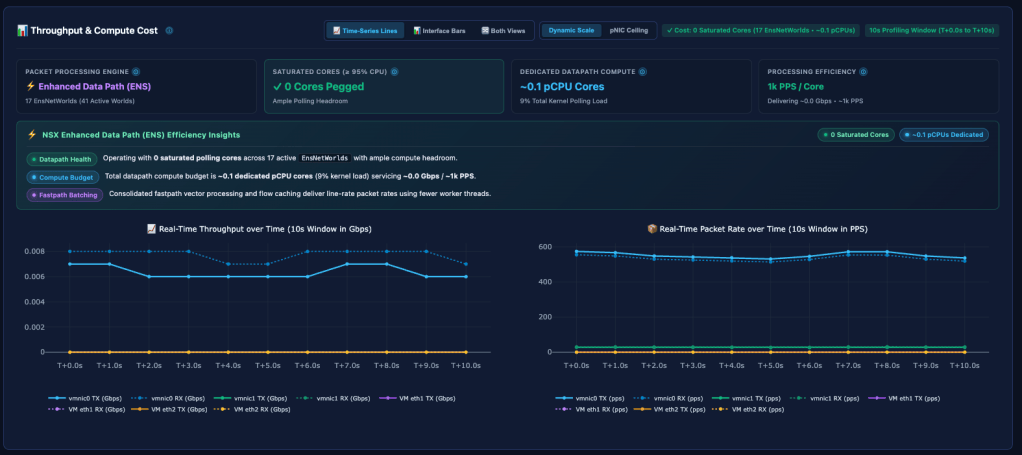
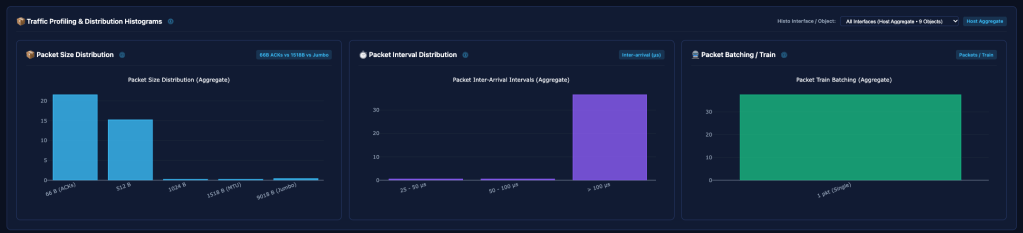
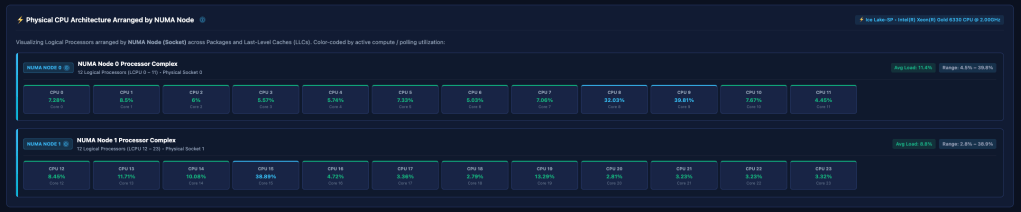
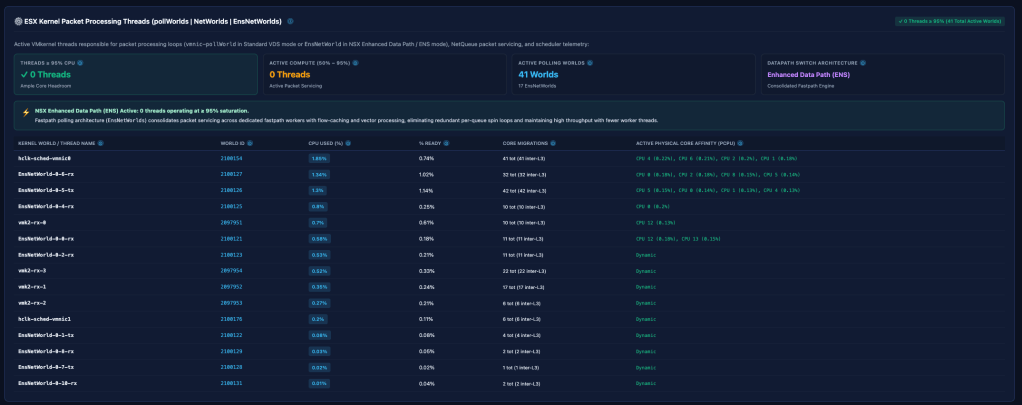
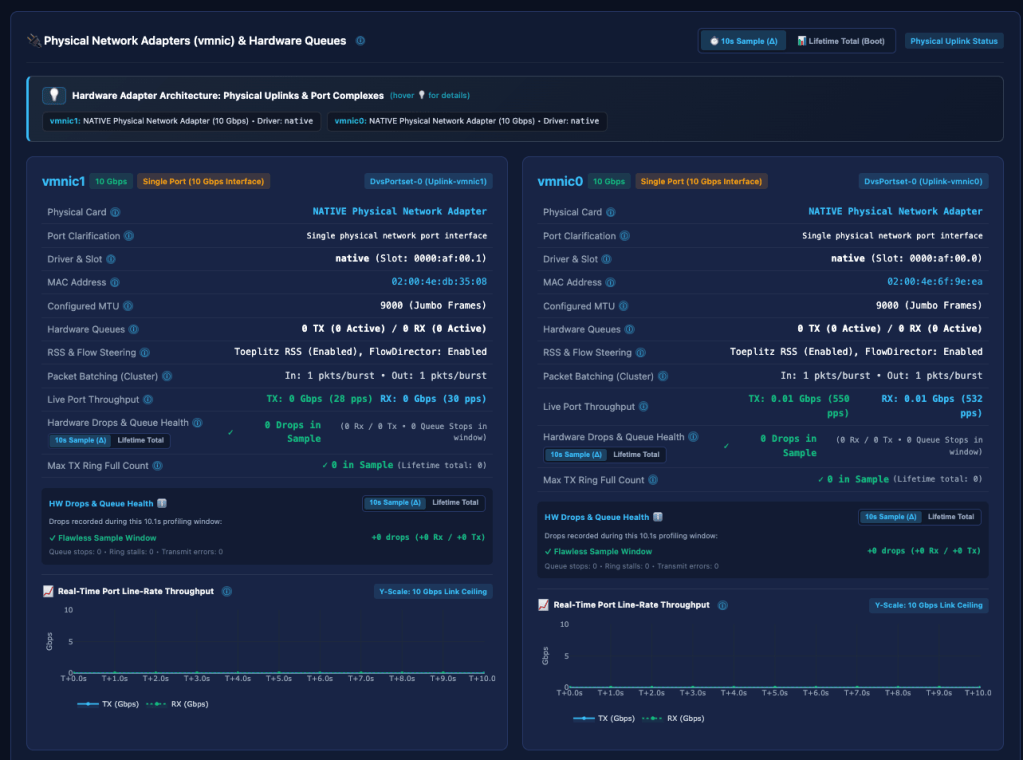
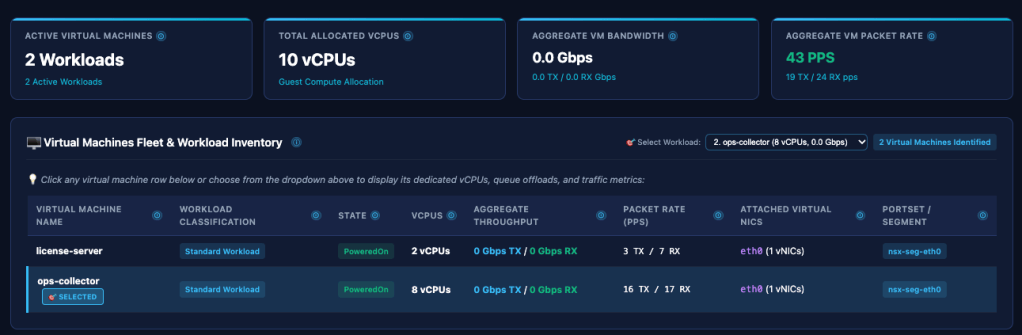
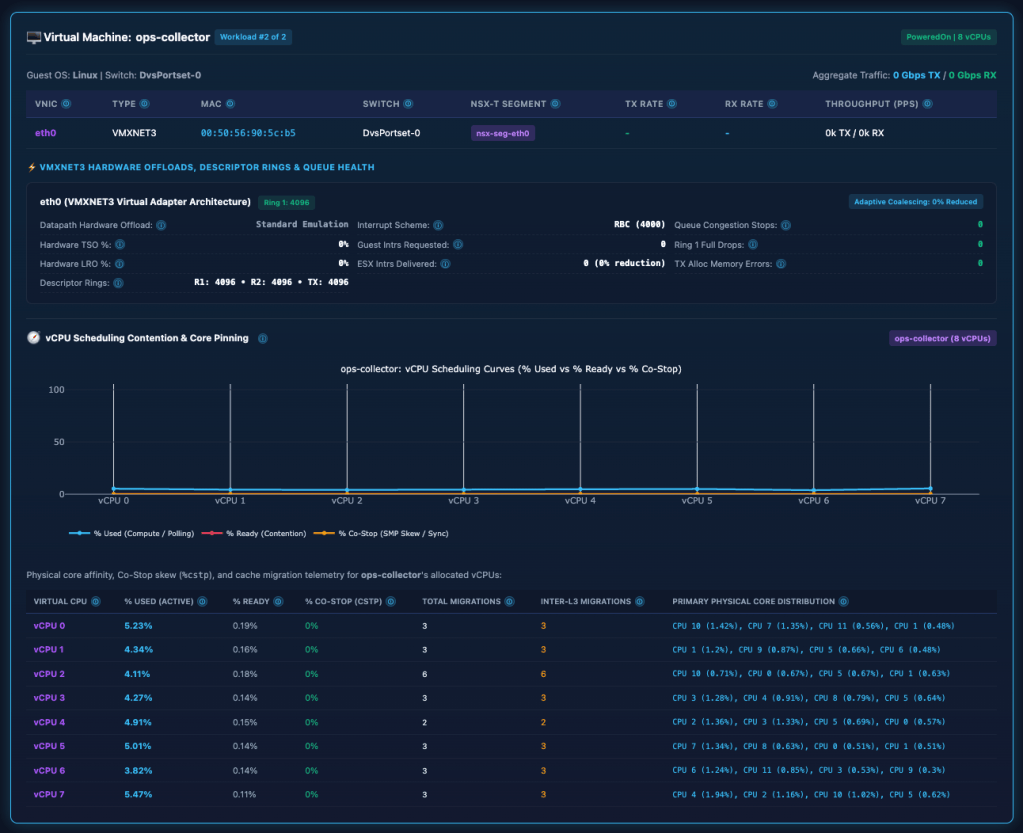
Example visualization of netstats & vsish data:
—
Gabe
P.S. 🫡 Happy Veteran’s Day fellow prior service members!
Old few photos from when I was stationed on the ex-USNS Niagara Falls in Guam. Veteran of good ol’ times.
The USNS Niagara Falls (T-AFS-3) was a Mars-class combat stores ship operated by the U.S. Navy’s Military Sealift Command (MSC).
Its primary mission was to provide continuous logistical support to deployed U.S. Navy ships, enabling them to remain at sea for extended periods without returning to port for supplies.